| 39.5 |
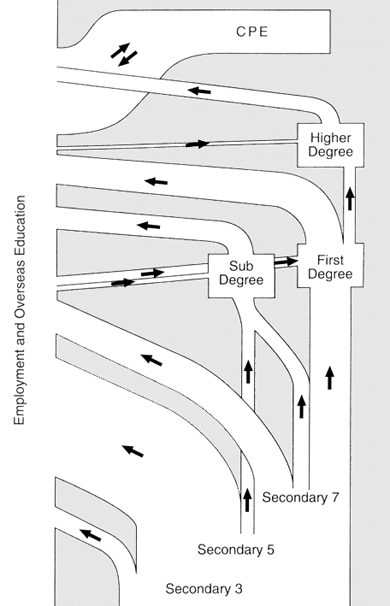
It will be seen that the major flow from school into employment occurs after secondary 5, although there are smaller flows at secondary 3 and secondary 7. Not all of these pupils are lost to higher education. Some will enter sub-degree or first degree courses on a part-time basis and many will benefit from CPE. At both secondary 5 and secondary 7 there are flows from school into sub-degree work, afforced by some entrants already in employment.
|
| 39.6 |
Full-time first degree courses recruit almost entirely from secondary 7, but there is a substantial flow into part-time undergraduate education from the employed. Most full-time first degree students enter employment after graduating, but about a quarter stay on to take postgraduate courses or become research students. They are joined by returners with employment experience.
|
| 39.7 |
The dominant single feature of the upper part of Figure 39.1 is not, however, any of the flows associated with sub-degree, first degree or higher degree work. It is the very large activity in CPE. In studying the diagram, it is important to remember that the width of each flow is proportional to the number of fte students entering the activity in a single year. For full-time courses lasting at least one year, this will be the first year enrolment. For part-time courses lasting at least one year it will be the first year enrolment multiplied by a full time equivalence factor. Many CPE courses, however, last less than one year, and a further scaling factor of the fraction of a year for which the course lasts has to be applied. The large flow shown for CPE thus represents several hundred thousand individual students. As can be seen, the magnitude of the flow into CPE is of the same order as those for all of the other forms of higher education combined.
|
| 39.8 |
In our Review, we devoted the four chapters of Section E entirely to this important area of CPE. There is a very large number of providers, including specialist units within the UGC institutions, the OLI, Caritas, VTC, HKMA and HKPC and many smaller organisations offering particular or general skills. A great deal of CPE is, of course, given in-house by employers. The present system seems to work well and to meet the needs of both students and employers. It has expanded rapidly in recent years and seems set to continue to do so.
|
| 39.9 |
It is, of course, possible to draw other pictures of the present landscape than that delineated in Figure 39.1. An obvious sub-division is by subject area. Business studies are very popular, with about a quarter of all undergraduates in Hong Kong taking them. There is some evidence that for Hong Kong first degree students in overseas universities, the proportion may be even higher. Business studies also attracts 25% of sub-degree students. Within the business area, a quarter (or 6% of all students) are reading accountancy.
|
| 39.10 |
Engineering has 15% of undergraduates both in Hong Kong and among Hong Kong students studying overseas, but this proportion is doubled for sub-degree courses. Electrical or electronic options are popular. The arts and science each attract similar numbers of undergraduates to engineering, but are less well represented at sub-degree level. Social sciences account for 10% of students and education is a smaller but important area. Medicine is high in terms of cost, but not in terms of numbers.
|
| 39.11 |
Business Studies (particularly the MBA) account for a quarter of taught postgraduate students. Education is of similar size and engineering and law are also important. There are few taught postgraduates in science or the arts. Two-thirds of research students are in scientific or technological areas. Nearly a half of RGC research grants go to science and medicine, and a third to engineering. Information on the subject balance within CPE is limited, but a great deal is concerned with various aspects of management.
|
| 39.12 |
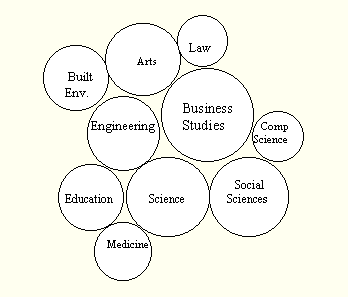
Taking an overall view, it may be said that the largest area of activity in higher education in Hong Kong is business studies. Engineering and science are also important, with the arts only marginally behind. Education and the social sciences follow, with computer science, the built environment, law and medicine occupying smaller but important niches. The distribution is shown pictorially in Figure 39.2.
|

